Create a Python and Flask based Stock Quote Module
In this article I will show you how to create a simple stock quote summary widget using Python and Flask. We will make a simple microservice-based API that will provide company information and historical data about a publicly traded company. We will then apply the data from the API to make a simple chart-based widget.
Introduction
Thank you for checking out my article! We will be building a Python based microservice API using the Flask microframework. We will build an API that returns stock quote information and leverage Flask's template system to create a simple Bootstrap 4 website to create a historical graph of stock prices.
We are going to use the yfinance module for Python, which use the Yahoo Finance API to provide stock information. This API is publicly accessible, but not guaranteed to perform for production use. Nonetheless it will provide us with a great data source for our sample code.

The AI Augmented Engineer: Software Development 2026-2030: A Practical Guide to Thriving in the Age of AI-Native Development
By 2030, 0% of IT work will be done without AI. Data-backed career roadmap for software engineers. No hype, no doom. Practical strategies that work.
Learn More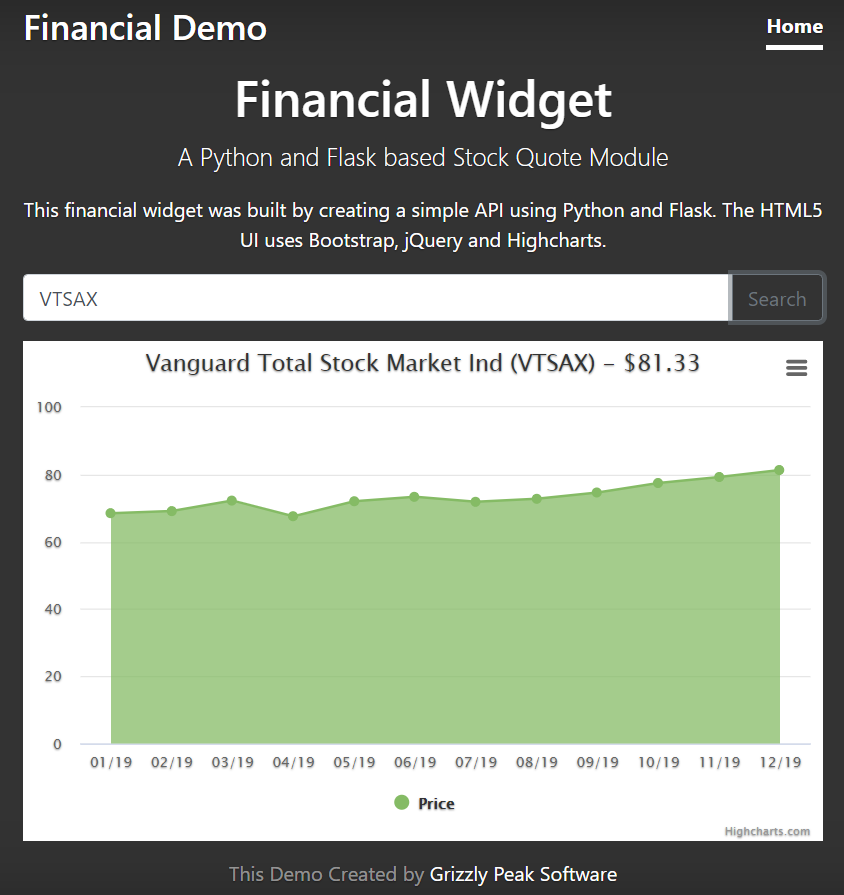
Sample Code for this Project
I have stored the code for this project in a git repository at the following location. https://github.com/grizzlypeaksoftware/Flask-Stock-Widget Please feel free to use the code in your projects!
If you want to clone the code to your local machine you will need to have git installed. Then you can navigate using your command line to the location where you would like to store the code and clone it to your machine.
git clone https://github.com/grizzlypeaksoftware/Flask-Stock-Widget
Installing Python and Flask
his guide assumes that you have at least a basic understanding of Python programming and how to perform general OS level tasks. You will need a code editor to create this application. I used Visual Studio code.
If you do not already have Python installed, you should install it. The installation for your operating system can be found at the following location. https://www.python.org/about/gettingstarted/
Once you have successfully installed Python on your operating system, you will want to install Flask.
pip install flask
Once the installation is complete you should now have Python and Flask running in your development environment.
Installing the yfinance Module
The next step will be to install the Yahoo Finance python module. Much like installing flask, we will use PIP.
pip install yfinance
You can learn all about this module on their github website. https://github.com/ranaroussi/yfinance . If you really want to get into coding using this module, I would recommend exploring their code because some features are not documented on their website.
This module leverages internal Yahoo API's that were built for their website. There are no guarantees on the data that gets returned from Yahoo Finance using this module.
Getting started with the API Controller
We will create a file called app.py, an we will start with the following code.
from flask import Flask, request, render_template
This means we will import the Flask module that we installed earlier, and we're going to use Flask, request and render_template for this project.
- Flask - the main Flask module
- request - provides a handler for the HTTP request object
- render_template - provides Flask with a handler for rendering HTML templates. We will use this later in the tutorial to create the demo website.
Next we will import the yfinance module.
import yfinance as yf
Next in app.py we will instantiate the flask application.
app = Flask(__name__)
And from here we are ready to finish off the first API call. Here is the completed code.
from flask import Flask, request, render_template
import yfinance as yf

app = Flask(____name____)

@app.route("/quote")
def display_quote():
  symbol = request.args.get('symbol', default="AAPL")

  quote = yf.Ticker(symbol

  return quote.info

if ____name____ == "____main____":
  app.run(debug=True)
This creates a single URL for the website that will contact Yahoo Finance and pull stock quote information in JSON format. So let's run the app!
From the command line type
python app.py
This will start the app running and should surface the API on it's default port (5000).
python app.py
* Serving Flask app "app" (lazy loading)
* Environment: production
   WARNING: This is a development server. Do not use it in a production deployment.
   Use a production WSGI server instead.
* Debug mode: on
* Restarting with stat
* Debugger is active!
* Debugger PIN: 146-068-908
* Running on http://127.0.0.1:5000/ (Press CTRL+C to quit)
If you were to go to the following URL, you should now see stock quote information for Apple listed in JSON in the Browser.
{
  "52WeekChange": 1.0365322,
  "SandP52WeekChange": 0.24646628,
  "address1": "One Apple Park Way",
  "algorithm": null,
  "annualHoldingsTurnover": null,
  "annualReportExpenseRatio": null,
  "ask": 309.42,
  "askSize": 1100,
  ...
}
Congrats! You are now getting stock quotes back from a simple API. But before we can draw a chart we will also need to pull some historical info.
Pulling Historical Data
We will do this by creating a new route called /history. We're going to set the period of time to be 1y, and the interval to be monthly.
@app.route("/history")
def display_history():

    symbol = request.args.get('symbol', default="AAPL")
    period = request.args.get('period', default="1y")
    interval = request.args.get('interval', default="1mo")
    quote = yf.Ticker(symbol)
    hist = quote.history(period=period, interval=interval)
    data = hist.to_json()
    return data
This works in much the same way as pulling the stock quote, except returns historical stock quote data so that you can render it into a price chart!
Once you hit save on the application, you should be able to access this new API route by going to http://localhost:5000/history
On both API's you can pass the symbol on the query string by adding ?symbol=
Congrats! You now have a working stock quote API that you can use to create a simple widget with a chart. Let's get started.
Setting up the Homepage using Flask
Flask comes with a simple template renderer called Jinja. We will use it to pull some HTML from the file system and render it to the browser. This is what we will use to create our website demo.
In order to do this you will need to create a folder in your project called "templates" because Jinja always looks in the templates folder. If you look in that folder you will find the HTML template. We're using a bunch of libraries in this HTML to make things easy so let's take a look.
You can find the HTML for this template at the following location. https://github.com/grizzlypeaksoftware/Flask-Stock-Widget/blob/master/templates/homepage.html
First you will see that we're pulling in the CSS for Bootstrap 4 via CDN. We are also using some of the Jinja markup in this template to pull in our static css file that is found in static/css.
<!-- Bootstrap core CSS -->
<link rel="stylesheet" href="https://maxcdn.bootstrapcdn.com/bootstrap/4.0.0/css/bootstrap.min.css" integrity="sha384-Gn5384xqQ1aoWXA+058RXPxPg6fy4IWvTNh0E263XmFcJlSAwiGgFAW/dAiS6JXm" crossorigin="anonymous">

<!-- Custom styles for this template -->
<link href="{{ url_for('static', filename='css/site.css') }}" rel="stylesheet">
In the lower area of the HTML we are calling a number of JavaScript libraries from CDN.
- jquery - A cross-browser all-purpose JavaScript library
- Bootstrap 4 - a UI framework for HTML5
- Highcharts - A javascript charting library
- Moment.js - A date/time converter for JavaScript
- Number.js - A number formatter for JavaScript
All of these scripts are referenced as follows…
<script src="https://code.jquery.com/jquery-3.4.1.min.js"></script>
<script src="https://cdnjs.cloudflare.com/ajax/libs/popper.js/1.12.9/umd/popper.min.js"></script>
<script src="https://maxcdn.bootstrapcdn.com/bootstrap/4.0.0/js/bootstrap.min.js" integrity="sha384-JZR6Spejh4U02d8jOt6vLEHfe/JQGiRRSQQxSfFWpi1MquVdAyjUar5+76PVCmYl" crossorigin="anonymous"></script>
<script src="https://code.highcharts.com/highcharts.js"></script>
<script src="https://code.highcharts.com/modules/exporting.js"></script>
<script src="https://code.highcharts.com/modules/export-data.js"></script>
<script src="https://code.highcharts.com/modules/accessibility.js"></script>
<script src="https://cdnjs.cloudflare.com/ajax/libs/moment.js/2.24.0/moment.min.js"></script>
<script src="https://cdnjs.cloudflare.com/ajax/libs/numeral.js/2.0.6/numeral.min.js"></script>
Finally, we will reference our own page's javascript file so that we can finish off the project.
<script src="{{ url_for('static', filename='scripts/site.js') }}"></script>
Rendering the template as a Web Page
Finally we will create a route in app.py in which we render the template as HTML on the page and test it.
@app.route("/")
def home():
    return render_template("homepage.html")
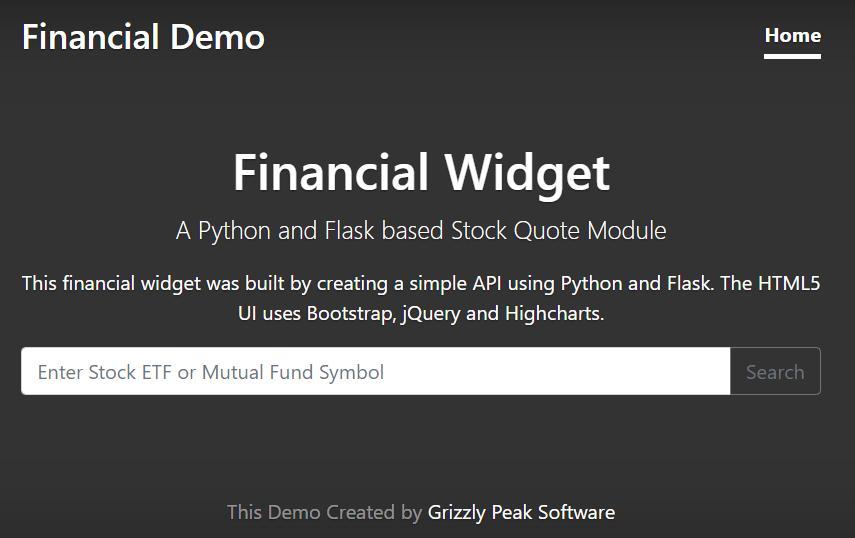
If you run the application again from the command line and then navigate to http://localhost:5000/ you should now see a website that looks roughly like this..
Pulling the API Content with AJAX
Now everything else will be done directly from JavaScript. We will query the stock API using jQuery's AJAX method, and get the quote and historical information. Since here are two calls, first we will get the quote, and then we will pull the history. This could also be done a little differently by pulling the quote and history simultaneously, but that's not how I set it up this time.
First this that happens with the page's DOM is loaded is that the page will call the Init() function, where we will initiate the request to get the Stock Quote.
Site.prototype.GetQuote = function(){
    // store the site context.
    var that = this;

    // pull the HTTP REquest
    $.ajax({
        url: "/quote?symbol=" + that.symbol,
        method: "GET",
        cache: false
    }).done(function(data) {

        // set up a data context for just what we need.
        var context = {};
        context.shortName = data.shortName;
        context.symbol = data.symbol;
        context.price = data.ask;

        if(data.quoteType="MUTUALFUND"){
            context.price = data.previousClose
        }

        // call the request to load the chart and pass the data context with it.
        that.LoadChart(context);
    });
};
Next we will load the chart data and pass it to the chart rendering function.
Site.prototype.LoadChart = function(quote){
    var that = this;
    $.ajax({
        url: "/history?symbol=" + that.symbol,
        method: "GET",
        cache: false
    }).done(function(data) {
        that.RenderChart(JSON.parse(data), quote);
    });
};
Once the data has been received, RenderChart is called, with the data that has been collected. We will then use Highcharts to render the chart data.
Site.prototype.RenderChart = function(data, quote){
    var priceData = [];
    var dates = [];

    var title = quote.shortName + " (" + quote.symbol + ") - " + numeral(quote.price).format('$0,0.00');

    for(var i in data.Close){
        var dt = i.slice(0,i.length-3);
        var dateString = moment.unix(dt).format("MM/YY");
        var close = data.Close[i];
        if(close != null){
            priceData.push(data.Close[i]);
            dates.push(dateString);
        }
    }

    Highcharts.chart('chart_container', {
        title: {
            text: title
        },
        yAxis: {
            title: {
                text: ''
            }
        },
        xAxis: {
            categories :dates,
        },
        legend: {
            layout: 'vertical',
            align: 'right',
            verticalAlign: 'middle'
        },
        plotOptions: {
            series: {
                label: {
                    connectorAllowed: false
                }
            },
            area: {
            }
        },
        series: [{
            type: 'area',
            color: '#85bb65',
            name: 'Price',
            data: priceData
        }],
        responsive: {
            rules: [{
                condition: {
                    maxWidth: 640
                },
                chartOptions: {
                    legend: {
                        layout: 'horizontal',
                        align: 'center',
                        verticalAlign: 'bottom'
                    }
                }
            }]
        }
    });
};
So, putting this all together, we should now have a stock market widget all complete that will pull all of the data and then draw the Stock Market widget on the page. We have added a little input form so that you can change the symbol by typing in a new symbol, like TSLA, MSFT, or VTSAX in order to show the information that that particular type of investment.
Once it's completed the finished website should look roughly like this…
Conclusion
In this article we used Python and Flask to make a simple stock market API that can pull data form Yahoo Finance and then apply it to create a simple website that shows a stock market chart.
I hope that you enjoyed this tutorial!
If you are interested in reading any of our other programming articles, some good ones to check out are…
Building an API Gateway with NGINX https://www.grizzlypeaksoftware.com/articles?id=4vlfDp2ZanpAh3bSuUzPeZ
Build a simple Node.js OAuth server with JWT https://www.grizzlypeaksoftware.com/articles?id=6G3prVhXnUeSYUEqEoCqq2
Create a secure web server in Node.js https://www.grizzlypeaksoftware.com/articles?id=JDcsPW2raSic6oc6MCYaM
Shout out to normcyr at github for being the first person to contribute to this code repo. Thanks for your constructive feedback!
